通过base plot和ggplot2的简单实例,直接感受下base plot和ggplot2的语法差别。

条形图
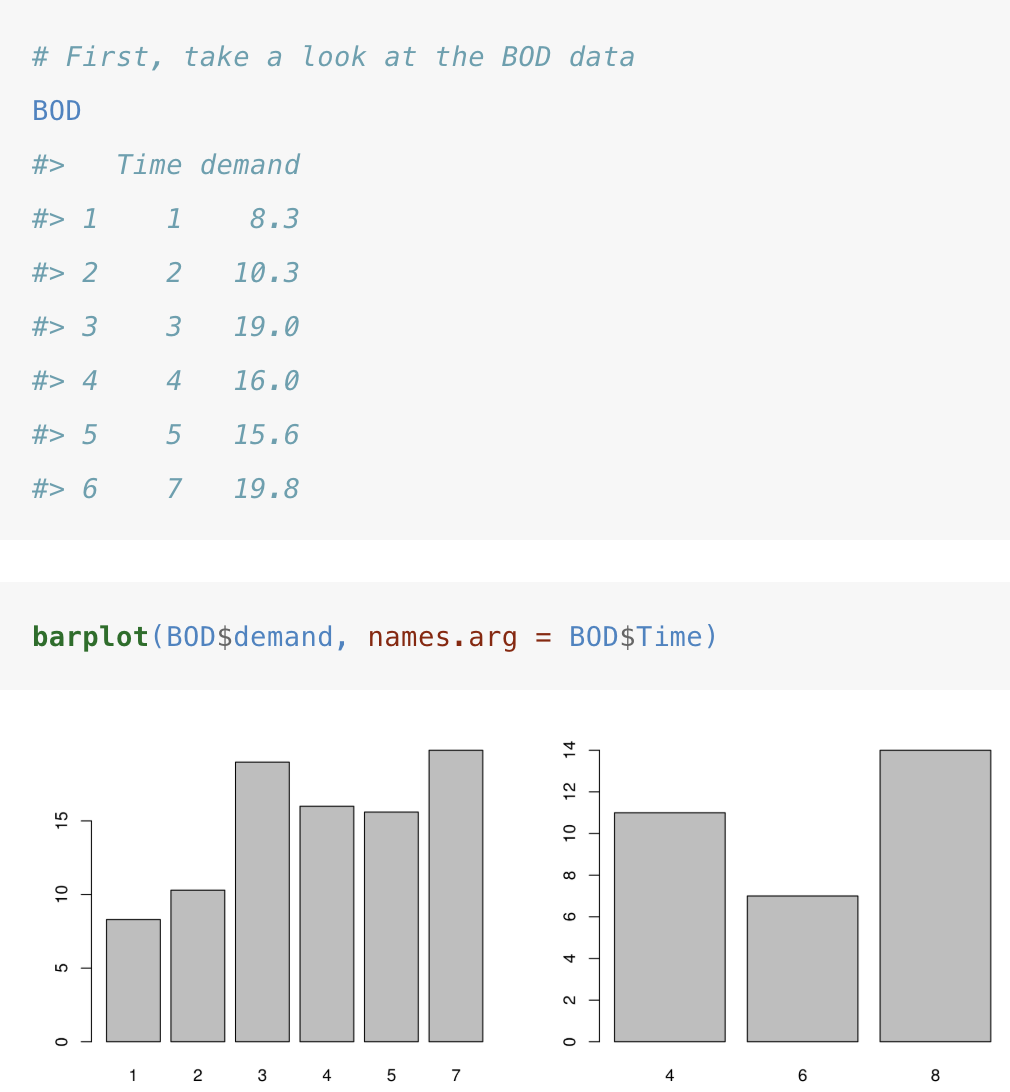
- 基本绘图
barplot()是基本绘图中绘制条形图的函数,需要一个向量参数指定bar的高度(必须),每个bar的label是可选参数。
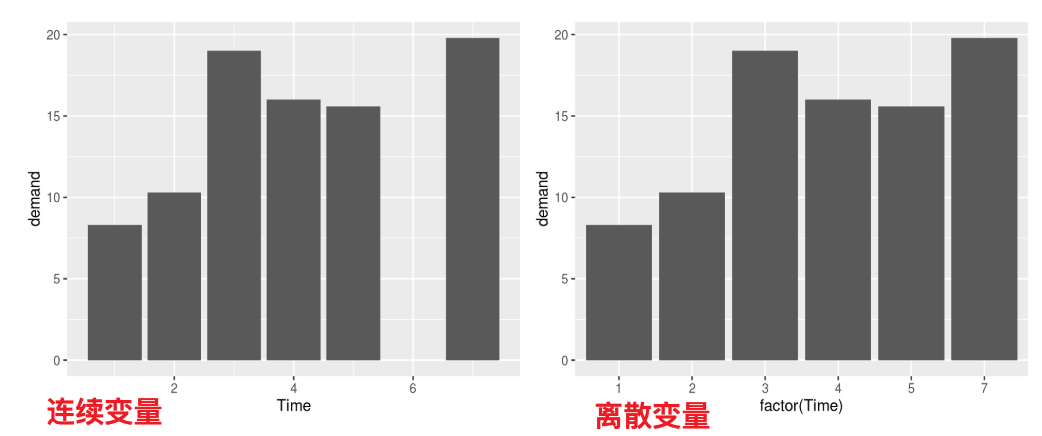
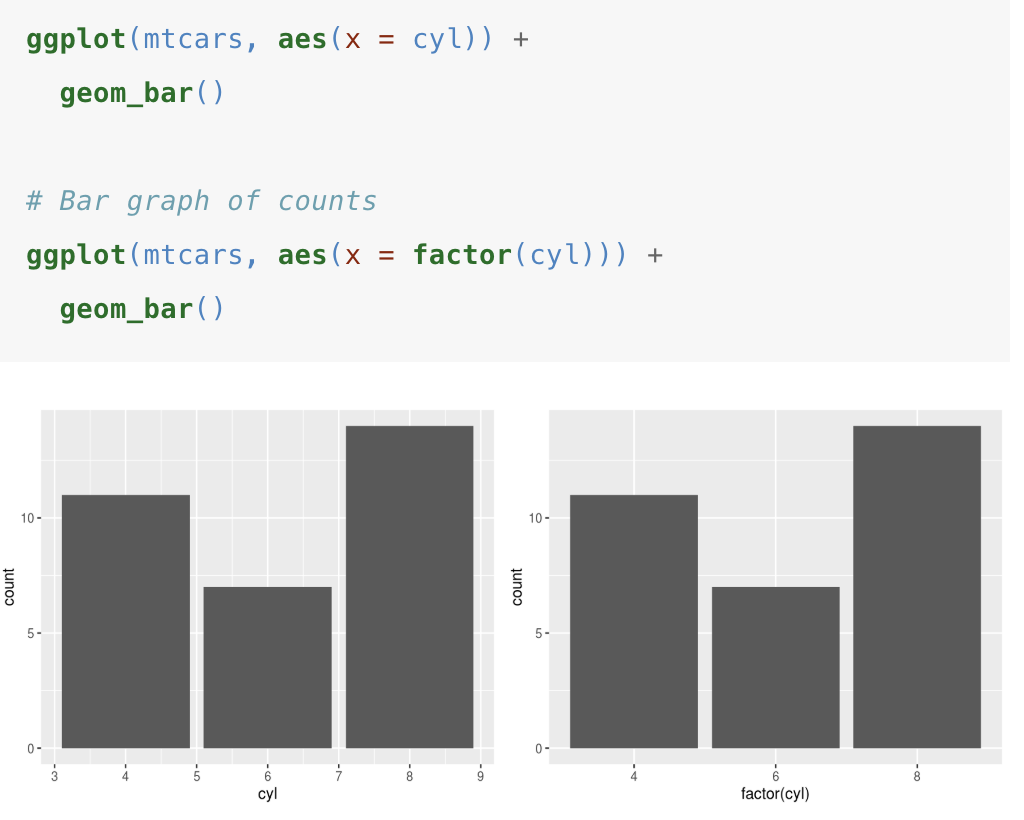
- ggplot2
ggplot2中绘制bar plot使用geom_col或geom_bar, 注意这里使用factor将x变量转换为离散变量。
1 | library(ggplot2) |
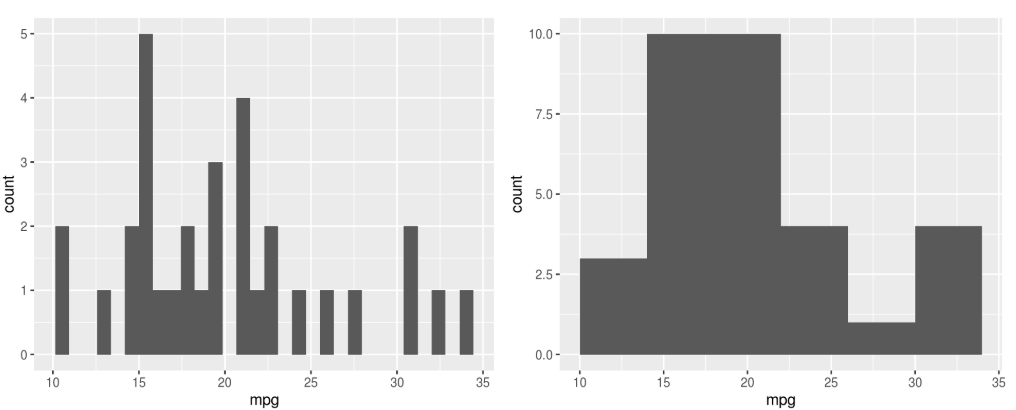
直方图
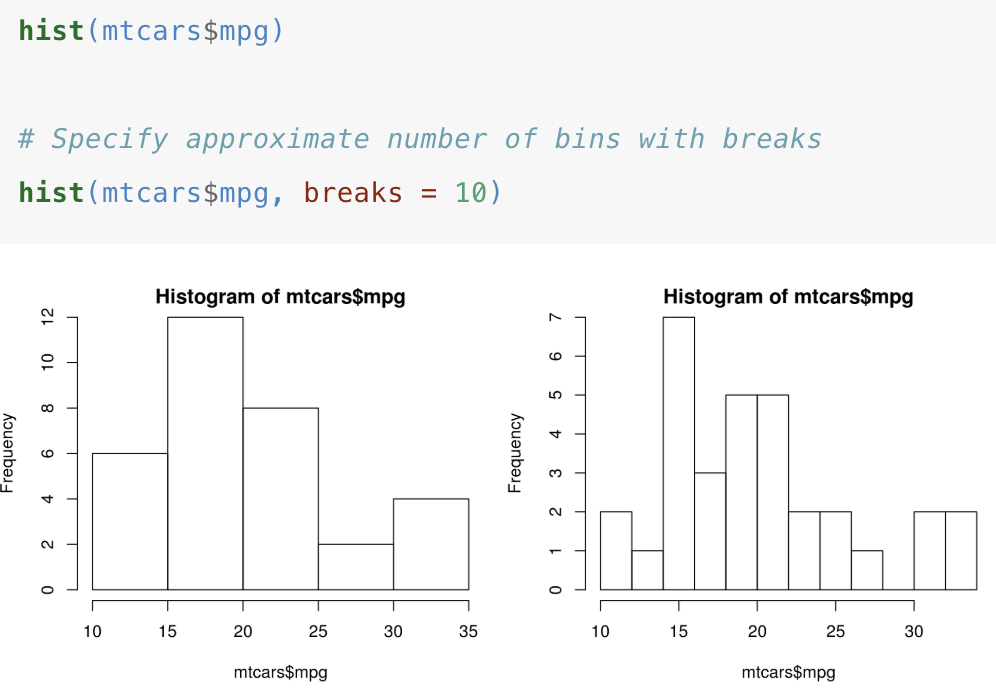
- 基本绘图
hist是基本绘图中直方图的函数。
- ggplot2
ggplot2中绘制直方图使用geom_histogram()
1 | library(ggplot2) |
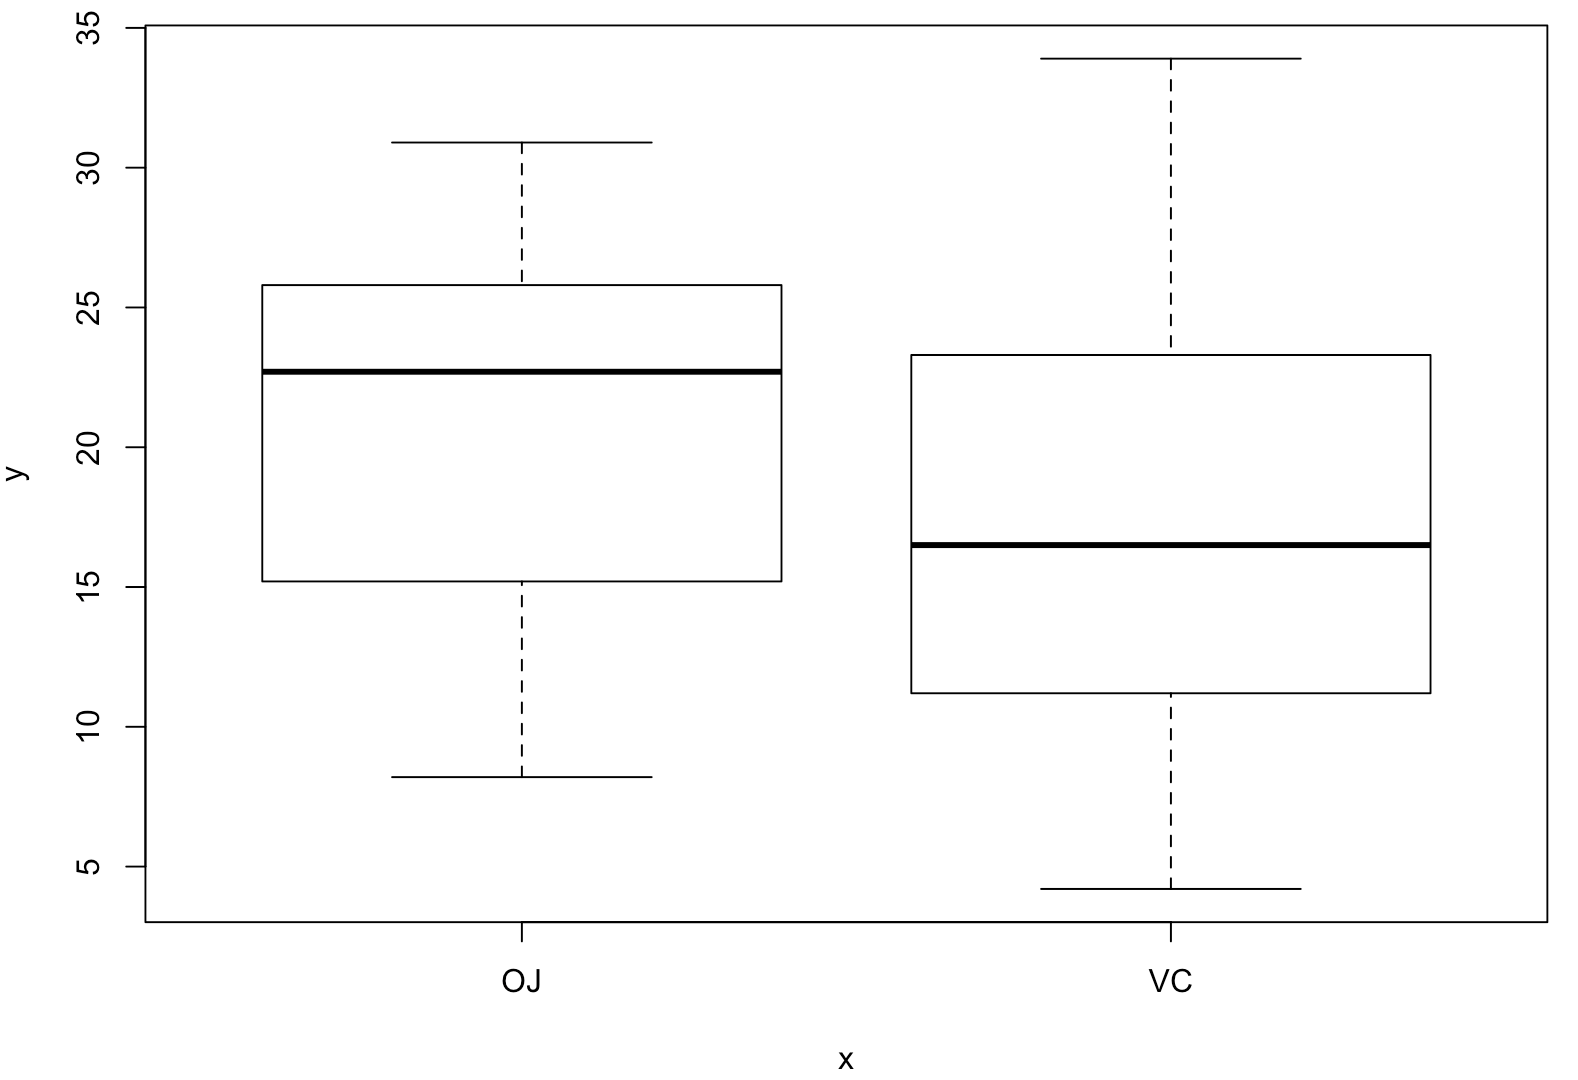
箱线图
- 基本绘图
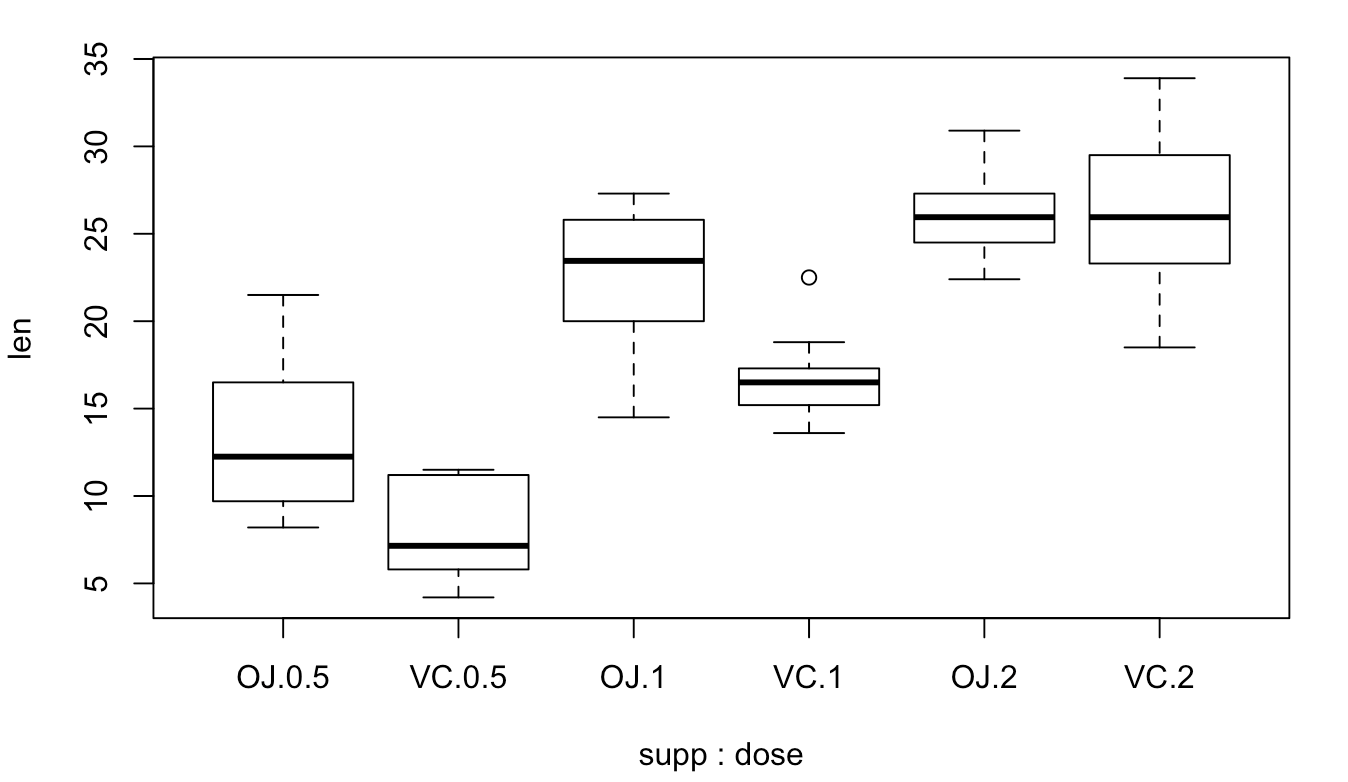
箱线图可以直接用plot()函数(如果x变量是factor,会自动产生bo x plot), 当然也可以用boxplot()函数。如果想在X轴展示两个变量,也是可以的。
1 | plot(ToothGrowth$supp, ToothGrowth$len) |
1 | # Put interaction of two variables on x-axis |
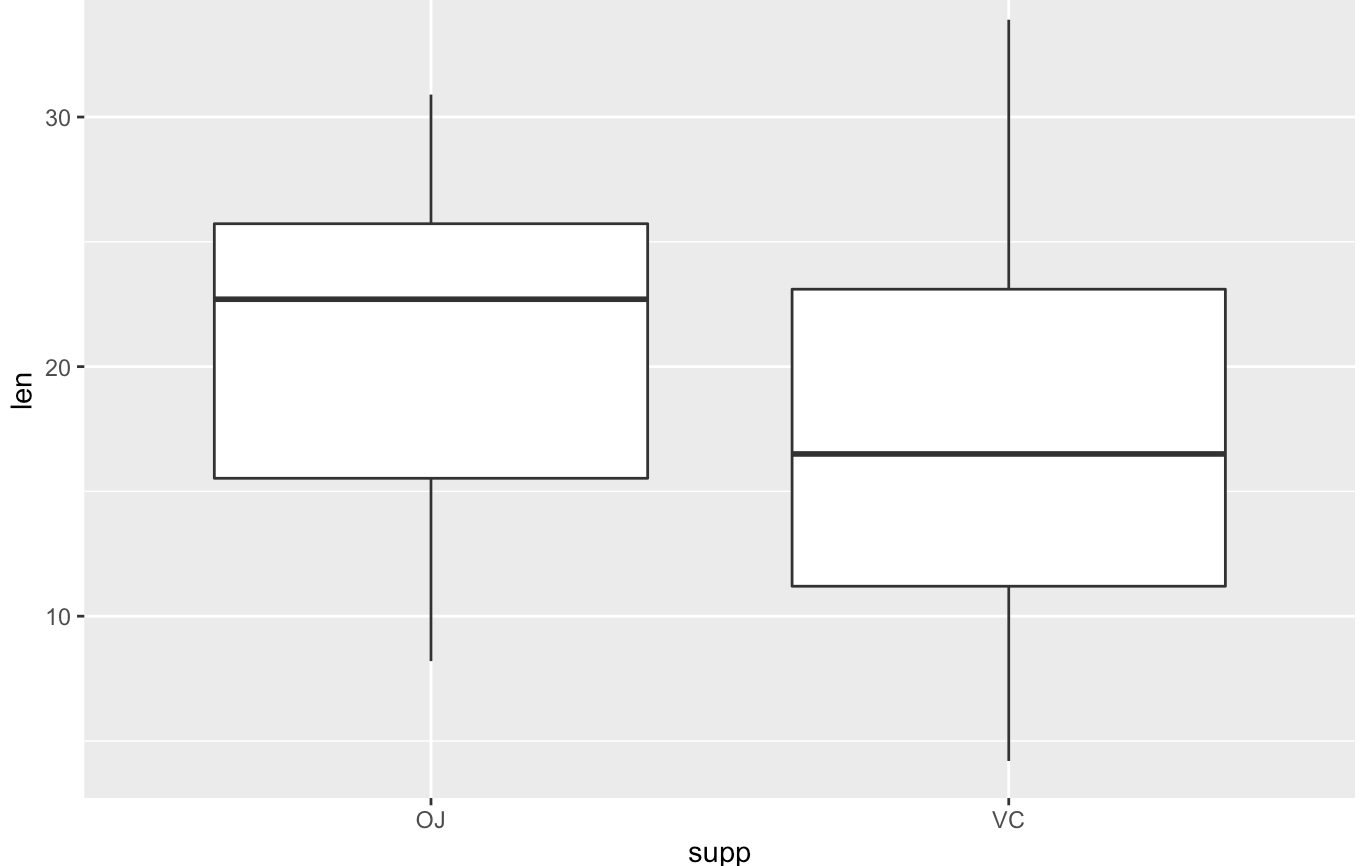
- ggplot2
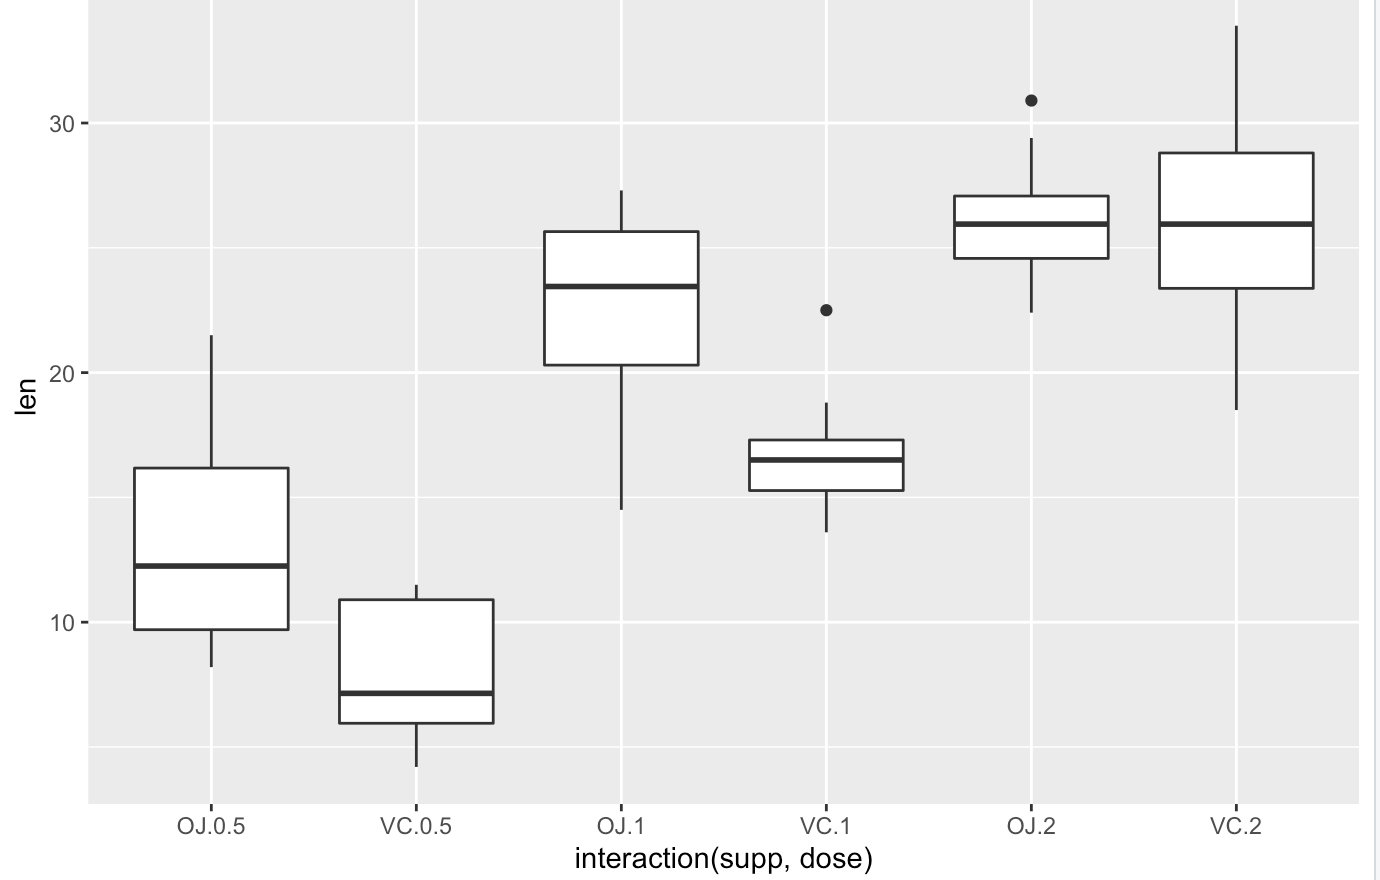
ggplot2使用geom_boxplot() 函数,x轴展示两个变量时可以用interaction()函数
1 | library(ggplot2) |
x轴展示两个变量
1 | ggplot(ToothGrowth, aes(x = interaction(supp, dose), y = len)) + |
小结
条形图、直方图、箱线图的区别
条形图x和y变量是一对一的关系,绘图时必须传递y变量。直方图是频率分布图,箱线图x变量对应的y变量有多个值。
Base plot和ggpplot2的绘图特征
Base plot直接指定变量参数即可,ggplot2的语法通常包括3个部分,首先是数据框,然后以aes指定参数变量,再加上图形的类型,如geom_boxplot等
箱线图展示一对变量的特征
如果用base plot实现,可以直接在x参数变量后加上另一个参数,如果是ggplot2,借助interaction()将一对变量添加。
个人感觉这里base plot画的图更简单好看。